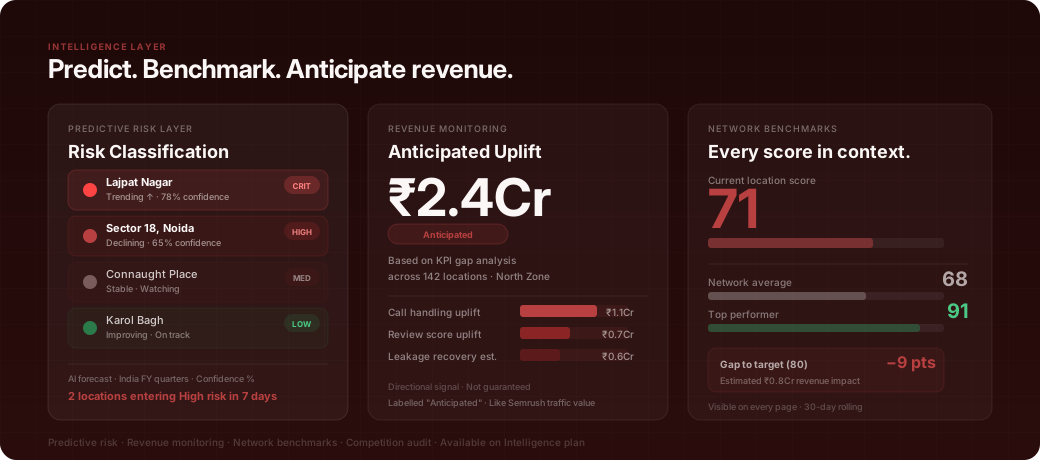
Predictive risk classification, network benchmarks, revenue monitoring, and competitive intelligence. The layer that turns operational signals into strategic decisions.
Risk classification at Low / Medium / High / Critical per location, with a directional forecast and confidence percentage. Three forecast lines. Closed-loop accuracy score that improves as the system learns your network's patterns.
India FY quarters built in. Available on Intelligence plan.
Based on AI benchmarks applied to current KPI gaps. Directional signal for executive reporting. Labelled "Anticipated". Not guaranteed.
AI benchmarks translate location KPI gaps into anticipated revenue uplift estimates. Labelled "Anticipated": directional signal, not a guarantee. Designed for executive reporting and pilot ROI framing, not operational dashboards.
Modelled on the same directional methodology used by platforms like Semrush for traffic value estimates.
Org average and top performer benchmarks visible on every page in Locus Intelligence. A score of 73 means nothing without knowing the network average is 68 and the top performer is 91. Context is built in. Not a separate report.
Google Maps pull across your dealer network: competitor presence near your locations, review position benchmarks, and visibility gaps. Structured by region. Delivered as a PDF for internal QBRs and pitch support. Run by the Locus Intelligence team.
Delivered at the start of every diagnostic pilot. Available on-demand for enterprise accounts.
Before the Risk Engine even goes live, you get a full competitive landscape map of your dealer network.
Apply for Pilot →The Locus Intelligence layer converts current location performance signals into forward-looking risk classification, revenue estimates, and competitive benchmarks. It is built for CMOs and COOs at multi-location home improvement brands in India who need to move from reactive reporting to proactive intervention, identifying which locations are heading toward failure before the quarterly results confirm it.
Low · Medium · High · Critical risk classification per location · Directional forecast + confidence % · Period completion projection
KPI gaps translated to revenue language via AI benchmarks · Anticipated revenue risk per location · Labelled as directional, not guaranteed
Org average + top performer on all pages · Network distribution view · Competitive intelligence via Competition Audit
The Predictive Risk layer analyses each location's current health score trajectory, the velocity of decline, pattern repetition frequency, and benchmark deviation to assign a risk classification. A location trending downward at an accelerating rate with repeated unresolved alerts and a score below the network average will classify as High or Critical before it breaches the failure threshold. The classification includes a directional forecast, the expected score at period end, and a confidence percentage based on how consistent the signal pattern has been.
The Revenue Monitoring layer uses AI-derived industry benchmarks to calculate the anticipated revenue risk associated with each location's KPI gap. If a location has a 20-point accountability score deficit versus the network top performer, the system estimates what that deficit represents in conversion terms, and translates it into an anticipated revenue impact. The estimates are labelled as directional, not guaranteed, consistent with how tools like Semrush label search traffic projections. The purpose is to make governance a revenue conversation, not just an operational one.
Every page in Locus Intelligence shows two benchmark reference points alongside each location's score: the organisation average and the top performer in that peer group. This means every regional head knows not just their region's score, but whether it is above or below the network average and how far it is from the top performer. Benchmarks make performance relative, a score of 68 means something different if the network average is 55 versus 78.
The Competition Audit is conducted by the Locus Intelligence team using Google Maps data and public signals. For each location in the pilot or full deployment, the audit shows how your brand's digital presence compares to the top 3 competitors in that catchment area. It is delivered as a PDF and is most commonly used in the Day 1 pilot briefing and in QBR presentations to senior leadership. It answers the question every CMO has but rarely has data for: where exactly are we losing to competitors at the location level?
The Predictive Period Completion feature projects each location's score at the end of the current period (India financial year quarters) based on current trajectory. Three forecast lines are shown: optimistic, base case, and pessimistic, each with a confidence percentage. A closed-loop accuracy score tracks how well previous forecasts performed, building credibility in the model over time. This feature is available on the Intelligence plan tier.
Predictive risk classification in Locus assigns each location a risk level of Low, Medium, High, or Critical based on trend analysis across its performance signals. Rather than waiting for a threshold breach to trigger an alert, the Intelligence layer detects early warning patterns, such as a gradual review response rate decline or a slowly drifting health score, and classifies the location as elevated risk before it reaches the alert threshold. This gives regional heads and HQ the opportunity to intervene proactively.
The competition audit feature pulls competitor GBP data for locations near each of your dealer sites using the Google Maps API. It generates a competitive benchmarking report showing how your dealers compare to nearby competitors on rating, review volume, response rate, and GBP completeness. This report is available as a PDF for use in QBRs and sales pitches. It is operated by the Locus team and is not a self-serve feature.